Bounce rate is a revenue metric for ecommerce. Benchmarks, root causes, and a practical SEO → GEO → AEO stack to reduce bounces and lift conversion.
Benchmarks
Average ecommerce cart abandonment rate is 70.19%.
Source: Baymard Institute — Cart Abandonment Rate Statistics (2024)
Average ecommerce conversion rate is often ~2–3% (varies widely by industry and traffic mix).
Source: IRP Commerce — Ecommerce Market Data (Jan 2026)
Key takeaways
- Peer-reviewed ecommerce research finds bounce rate has a statistically significant negative effect on goal conversion rate (Roy & Sharma, 2021).
- Benchmarks vary by context: a nominal ecommerce bounce rate often sits around ~40%, with high-risk thresholds commonly above ~60%.
- Speed is the most consistent causal driver: Google’s mobile study found bounce probability rises sharply as load time increases (1s→3s: +32%; 1s→5s: +90%).
- SEO, GEO, and AEO reduce bounce upstream by aligning intent and pre-qualifying clicks—then on-page UX keeps the visitor.
On this topic: Ecommerce Simulator · Free Ecommerce Website Audit Checklist — UX, SEO & GEO, Your Return Policy Is Either Making or Losing You Money — Here's What the Science Actually Says
A research-backed guide for online store owners. Bounce rate is not a vanity metric in ecommerce—it’s often a direct proxy for lost revenue. Here’s what the science says and what to fix first.
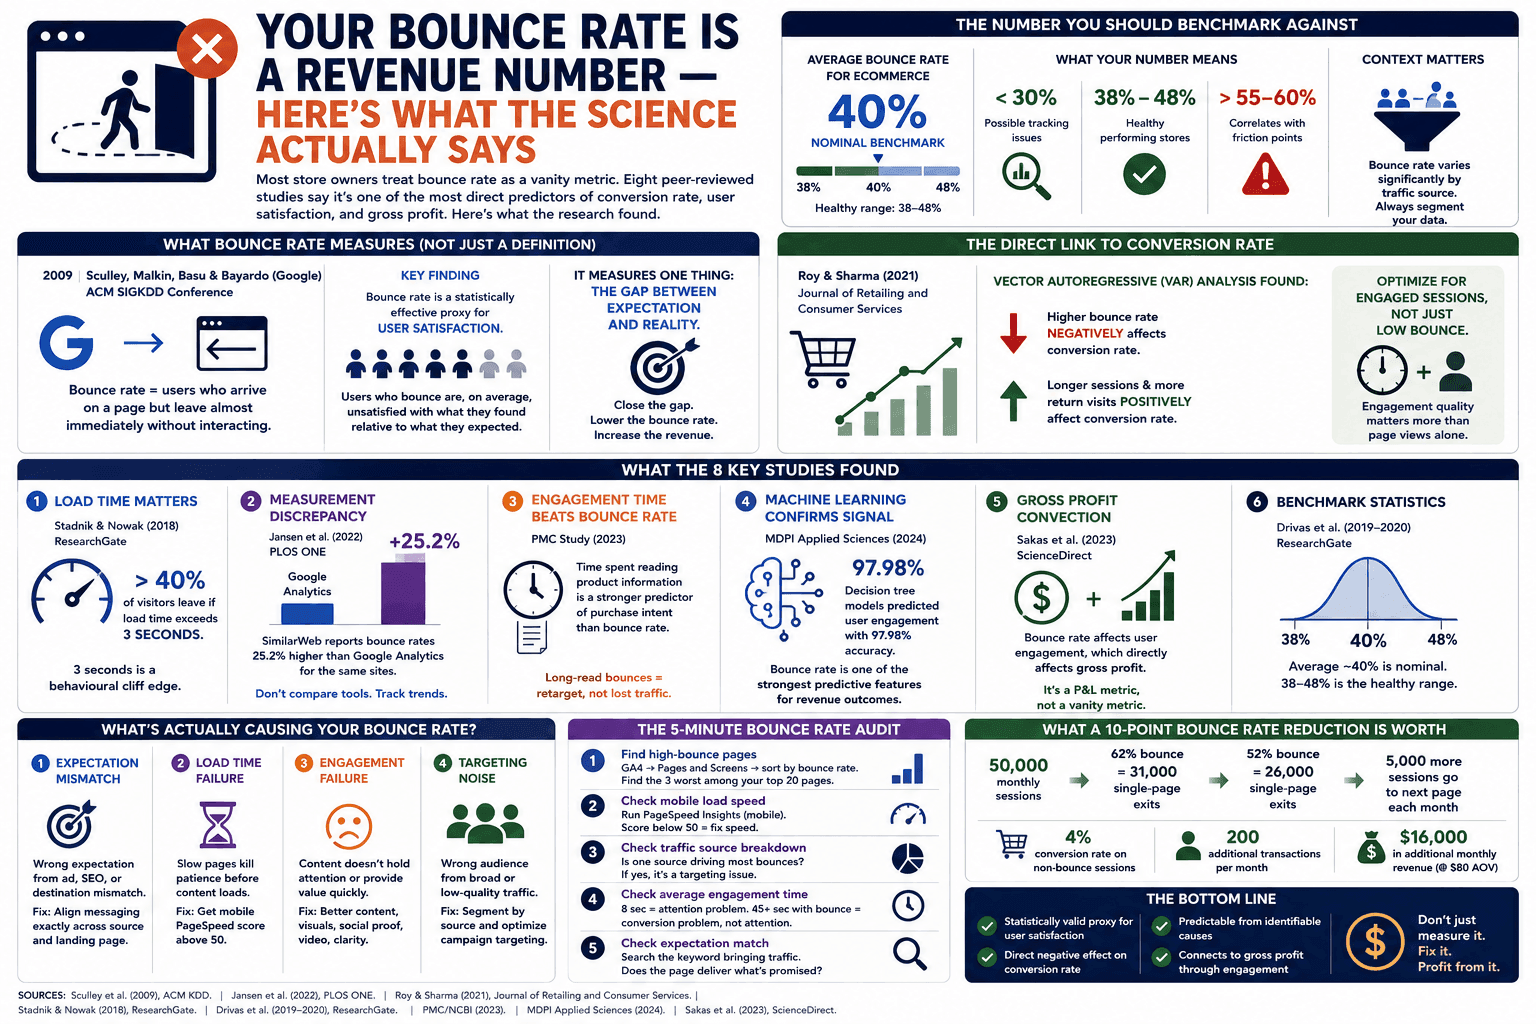
What is bounce rate and why it costs you sales
Bounce rate is the percentage of visitors who land on your website and leave without any further interaction — no second page, no click, no purchase. In Google Analytics 4 (GA4), a bounce is specifically a session where a user exits within 10 seconds without any engagement event.
For ecommerce, every bounce is a missed revenue opportunity. Research by Roy & Sharma (2021) in the Journal of Retailing and Consumer Services used a Vector Autoregressive (VAR) model across real ecommerce data and found a statistically significant negative effect of bounce rate on goal conversion rate. The same study confirmed that high average session duration and return visits positively predict both goal completion and sales.
The scientific benchmarks
Industry data triangulated from multiple sources puts ecommerce bounce rates in the following ranges:
| Benchmark | Rate |
|---|---|
| Top-performing ecommerce stores | 20% – 38% |
| Average ecommerce benchmark | 38% – 48% |
| High-risk threshold (needs attention) | >60% |
| Mobile (historically higher) | ~48–51% |
| Health & Beauty category peak | ~51.6% |
The most authoritative measurement caveat comes from Jansen, Jung, Salminen et al. (PLOS ONE, 2022), which analysed 86 websites across 26 countries and 19 industry verticals, comparing Google Analytics with SimilarWeb data. They found SimilarWeb reports bounce rates 25.2% higher than Google Analytics — crucial when you’re benchmarking against reports that use different sources.
The foundational academic definition of bounce rate as a quality signal comes from Sculley et al. (KDD 2009), a Google research paper that formalised bounce rate as a valid proxy for user satisfaction.
Why visitors bounce: evidence-based root causes
1. Page load speed (the #1 driver)
The most cited causal factor is page load time. Google’s mobile study (900,000+ landing pages) found:
- Load time increases from 1s → 3s: bounce probability rises 32%
- Load time increases from 1s → 5s: bounce probability rises 90%
Page speed is also an SEO lever (Core Web Vitals). If you’re working through conversion benchmarks and speed, pair this with 2026 conversion rate benchmarks by store type.
2. Content-visitor mismatch (intent misalignment)
Drivas et al. (2019–2020) argue many bounces are not “true disengagement”—they can be accidental landings, poor targeting, or pages that do not match query intent. For ecommerce, ~40% can be nominal only when traffic is well-targeted; when targeting is off, bounce inflates regardless of design quality.
3. Product page engagement time
Wu et al. (PMC/NCBI, 2023) found time spent reading product information can be a stronger predictor of purchase intent than bounce rate alone. In practice: lowering bounce is not enough; you need high information density and clarity after the click.
4. Trust deficits
Trust is a primary antecedent of purchase intention in ecommerce (Gefen, Karahanna & Straub, 2003). If a shopper doesn’t trust the store, they leave immediately. Reviews, clear returns, security cues, and transparent shipping expectations reduce the psychological friction that causes bouncing.
Part I: SEO solutions — fixing bounce at the traffic level
Most bounce problems begin before a visitor even lands. SEO determines who lands on your site and what they expect to find.
Fix 1: Align keywords to buyer intent, not volume
Ranking for high-volume but low-intent queries manufactures bounces. Prioritise transactional and commercial intent terms (“buy X”, “best X for Y”, “X vs Y”) over broad informational phrases.
Fix 2: Page speed as an SEO and bounce fix simultaneously
Core Web Vitals are both a ranking signal and a primary technical driver of bounce. Evidence-based thresholds:
- LCP: under 2.5 seconds
- INP: under 200ms
- CLS: under 0.1
Fix 3: Meta title & description expectation setting
If your snippet promises something different from what’s on the page, visitors bounce instantly. Align your title and description to what the landing page actually delivers (price signals help on product and collection pages).
Fix 4: Mobile-first technical SEO
Mobile bounce is typically higher due to network conditions and mobile UX. With mobile-first indexing, poor mobile performance hurts both rankings and bounce outcomes—treat mobile as its own funnel.
Part II: GEO solutions — fixing bounce from AI-driven traffic
Generative Engine Optimization (GEO) optimises content to increase visibility in AI-generated answers (ChatGPT, Perplexity, Google AI Overviews). When a brand is cited inside an AI answer, downstream clicks are often more pre-qualified—reducing mismatch-driven bounce.
If you’re building a GEO-ready content system, start with the foundational guide: Generative engine optimisation (GEO) for the AI era.
- Write for synthesis: answer constrained product questions clearly.
- Add statistics and verifiable claims: increases citation likelihood and reduces post-click confusion.
- Structured product attributes: size, materials, use-cases, price, availability.
Part III: AEO solutions — fixing bounce from answer engine queries
Answer Engine Optimization (AEO) structures content so answer engines select it for direct responses. For ecommerce, AEO is most valuable for purchase-intent queries (“best X for Y”, “X vs Z”, “where to buy X”). Visitors arriving after an AI answer expect the page to match the answer—front-load clarity or they bounce.
- Answer-first structure: put a 40–60 word direct answer at the start of major sections.
- Schema markup: `Product`, `FAQ`, `HowTo`, `Organization` where relevant.
- FAQ sections aligned to PAA: target the questions people ask before clicking.
- Entity clarity: consistent product/category naming across your site and mentions.
The unified framework: SEO → GEO → AEO as a bounce reduction stack
[SEO] Controls WHO arrives and with WHAT intent
  ↓
[GEO] Controls HOW AI systems represent you before the click
  ↓
[AEO] Controls WHAT QUESTION is pre-answered before the visitor arrives
  ↓
[On-Page UX] Controls whether the visitor stays (speed, trust, content match)
  ↓
[Bounce Rate Outcome]
Summary: evidence-based action list
- Get load time under 3 seconds (then chase CWV thresholds).
- Fix keyword-to-intent alignment. Don’t rank for queries you can’t satisfy in one scroll.
- Optimise mobile separately. Mobile is its own funnel.
- Increase product information density. Help the buyer decide faster.
- Add trust signals near the decision point. Don’t hide returns and shipping.
If you want to stress-test the revenue impact of conversion changes (including bounce-driven conversion deltas), run scenarios in the Ecommerce Simulator.
Key sources: Sculley et al. (2009, KDD) | Roy & Sharma (2021, JRCS) | Jansen et al. (2022, PLOS ONE) | Wu et al. (2023, PMC/NCBI) | Aggarwal et al. (2024, KDD GEO) | Bagga et al. (2025, E-GEO) | Gefen et al. (2003, MISQ)