Conversion rate optimization in 2026: what actually works (with receipts), what to avoid, and a practical 90-day playbook—speed, headlines, forms, checkout, and honest A/B testing.
Benchmarks
Average ecommerce cart abandonment rate is 70.19%.
Source: Baymard Institute — Cart Abandonment Rate Statistics (2024)
Average ecommerce conversion rate is often ~2–3% (varies widely by industry and traffic mix).
Source: IRP Commerce — Ecommerce Market Data (Jan 2026)
Key takeaways
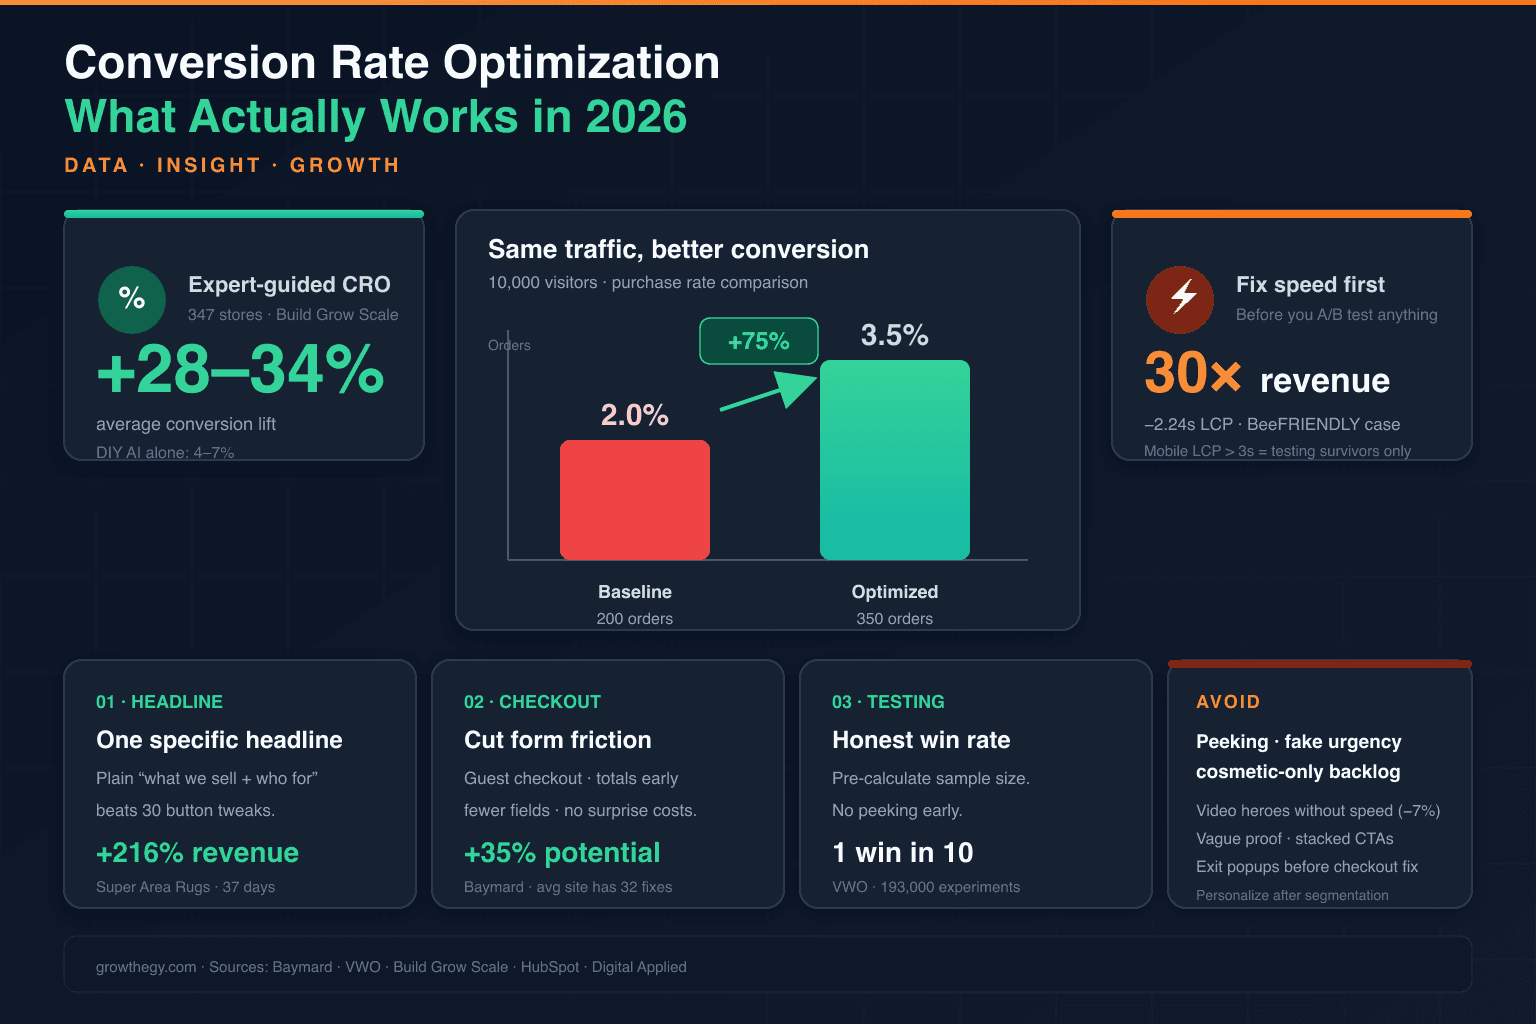
- Same traffic at 2% vs 3.5% conversion is +75% more orders—CRO compounds before you buy more ads.
- Expert-guided programs averaged 28–34% lift across 347 stores; DIY AI without hypotheses averaged 4–7%.
- Fix mobile speed, rewrite one specific headline, show proof next to the CTA, and cut checkout friction before cosmetic tests.
- Expect ~1 real win per 10 tests; document losers—they feed the next hypothesis.
On this topic: Ecommerce Simulator · Online Business Lost Sales: The Complete 2026 Data Study — Why 70% of Carts Abandon, 7 Out of 10 Customers Leave Without Buying — Here's the Exact Science Behind Why
Most stores do not have a traffic problem—they have a conversion problem. This playbook distills Baymard UX research, VWO’s experiment dataset, published case studies, and academic papers into practical steps you can run this quarter, plus a kill list of tactics that consistently waste time.
The math that makes CRO worth it
Conversion rate optimization (CRO) is raising the percentage of visitors who complete the action you care about—purchase, trial, demo, lead, add-to-cart. Macro conversions are the money event; micro conversions are the steps toward it (pricing views, form starts, video plays). Track both so you see where interest turns into hesitation.
Conversion rate % = (Conversions ÷ Visitors) × 100
Judge tests on revenue per visitor, not conversion alone. A variant can lift form fills while hurting margin, average order value (AOV), or lead quality. Always pair a primary metric with guardrails.
Example: 10,000 visitors at 2% = 200 orders. At 3.5% = 350 orders. That is +75% more revenue on the same ad spend. Then you scale spend—and the multiplier compounds. Rehearse that trade-off in the Ecommerce Simulator before you commit budget.
TL;DR — seven rules with receipts
- Fix speed first. Mobile LCP over 3s means you are testing on survivors. One case cut 2.24s and went from about $48k to $1.44M/year (30×). Google/Deloitte: 0.1s faster ≈ +8.4% ecommerce conversion.
- Rewrite one specific headline. Super Area Rugs replaced clever wordplay with plain “what we sell + who for” → +216% revenue in 37 days. A 2,000-page study found single-stat heroes (+18%) beat video autoplay (−7%) and stock team photos (−11%).
- Test the inversion. Donate For Charity ran sorrow vs product vs joy imagery—joy won +494% in 30 days. When five competitor heroes look identical, the opposite often wins.
- Run one low-confidence test. Enzymedica’s “coin-flip” variant went 3.4% → 16.9% on Black Friday (5×). High-confidence ideas are often already priced in.
- B2B: name the pain, not the benefit. EM360 went 0.12% → 7% in 30 days (58×) by putting the operational enemy on the hero line—not “streamline workflows.”
- Expect 1 win in 10. VWO’s 193,000 experiments: CTA copy wins ~10%, search bar tweaks ~12%. Plan 40–50 tests per quarter if you want 4–5 real wins.
- Trust first, personalization last. A 184-person study (Ziakis, 2026): trust (reviews, guarantees) ranked #1; personalization ranked last except for ages 35–44.
What works — and how to do it
1. Speed is the gating layer
Portent: a 1-second site converts about 3× a 5-second site. Shopify cites +27% mobile conversion per second saved. LCP thresholds: under 2.5s good, over 4s fatal—roughly 40% of sites fail.
How: WebP images, lazy-load below fold, preload hero, defer non-critical JS, CDN, TTFB under 600ms. Measure mobile LCP on a real phone. If you are above 3s, pause other tests until you are under 2.5s.
2. One headline beats thirty button tweaks
Visitors scan in an F-pattern—they rarely finish sentence two. Run a five-second test with someone unfamiliar: can they say what you sell and who it is for?
How: Replace clever with concrete. Stack + price + outcome in ~30 words. Named proof (“Used by 8 of Fortune 50”) beat vague “trusted by thousands” by +22% in a 2,000-page study. Move one real testimonial (face, name, title) next to the primary CTA.
3. Sticky CTA — but do not stack CTAs
Sticky-bottom CTA alone: +11%. Above-fold alone: +6%. Both together: +12%—the sticky captures almost all the benefit. Three or more hero buttons: −8% (paralysis).
How: Ship sticky-bottom + one inline mid-page CTA. Drop redundant above-fold buttons if they create layout friction. Match verb to buying mode: “Get a quote” for agencies, “Buy now” for DTC impulse SKUs.
4. Forms and checkout: subtraction wins
HubSpot: 4 fields → 3 = +50%. Baymard: ideal checkout is 12–14 elements (~7–8 fields); average US checkout shows 23.48. Cart abandonment sits around 70.19% across studies. Top UX causes: surprise costs (39–48%), slow delivery info (20–22%), distrust (18–19%), forced account (18–24%).
How: Delete every field you do not use for follow-up. Guest checkout always—offer account creation after purchase. Show shipping + tax on product and cart pages, not at the final step. Inline validation after the field, preserve all data on error, autoscroll to the first mistake. Mobile: Apple/Google Pay, autocomplete, single column, large tap targets.
For a full checkout audit, pair this with our checkout optimization guide and lost-sales data study.
5. Message match beats homepage traffic
Dynamic headline matching search intent: +57–58% (Campaign Monitor). Sending paid traffic to your homepage is still the #1 conversion killer—one ad angle deserves one page that finishes the ad’s sentence.
How: Build dedicated landing pages per campaign angle. Refuse to scale spend until the page converts profitably on its own segment (device × source × new/returning).
6. Expert process beats DIY AI
Build Grow Scale (347 stores): expert-guided AI CRO averaged 28–34% lift; DIY AI without an expert averaged 4–7%. Same software, five-fold gap—the hypothesis and evidence layer is human.
Hypothesis format: “Because we observed [evidence], we believe changing [element] to [variation] will improve [metric] for [audience].” Score with EPIC or ICE, pre-calculate sample size before you build, and run power math (Evan Miller’s calculator) so you are not waiting eight months to detect a 10% lift on a 3% baseline.
What does not work — kill list
- DIY AI without an expert (4–7% lifts). AI surfaces what training data already knows; experts surface what it does not.
- Video heroes without infrastructure (−7%). No poster, no preload, no LCP measurement = slower page that loses more than video gains.
- Vague proof. Logo strips and unbacked stars are decoration. Specificity converts.
- Stacking fallacy. Sticky + above-fold + walls of testimonials ≠ compound wins. Subtraction wins.
- Cosmetic backlogs. Button colors while pricing, packaging, and checkout sit untouched. Structural tests need leadership buy-in—that is where revenue lives.
- Peeking. Checking results before sample size hits turns 5% false positives into 15–20%. ~80% of early-declared winners do not replicate.
- Fake urgency. Invented countdowns lift short-term and destroy LTV.
- Personalization before segmentation. Sequence: RFM/behavioral segments first, platform personalization later.
- MVT as default. Needs 50k+ visitors per page. Most teams waste six months; 12 focused A/B tests would compound faster.
- Exit popups over broken checkout. Fix the wall first; retargeting re-exposes the same friction.
90-day playbook (practical order)
Phase 0 — Week 1: trust your numbers
- Define one primary metric + at least one guardrail per money page.
- Verify GA4 events fire once (purchase, generate_lead, sign_up)—no double-count, bot filter on.
- Baseline by device × source × new/returning × landing page.
- Install heatmaps/recordings (Microsoft Clarity is free). Watch 50+ abandon sessions per template.
Phase 1 — Weeks 2–3: research friction
- Find the loudest funnel drop (cart vs checkout vs PDP).
- Ask “What almost stopped you?” on high-exit pages.
- Interview 3–4 recent customers; mine support tickets and sales-call notes.
- Same objection in analytics + recordings + voice = evidence. One recording is an anecdote.
Phase 2 — Week 4: prioritize
- Write hypotheses in the format above. Score EPIC/ICE.
- Run 1–3 concurrent tests max. Pre-calculate sample size and duration (≥14 days, full weekly cycles).
Phase 3 — Weeks 5–12: test in this order
- Speed if LCP > 3s (gating)
- Headline message-match (dynamic if paid)
- CTA specificity + anxiety line (“No card required”)
- Proof moved to CTA + specific numbers
- Form cut + guest checkout + total shown early
- Pricing simplify (tiers, annual default, recommender)
- Exit lower-commitment offer (guide vs trial)
- Post-purchase upsell (AOV without purchase friction)
Phase 4 — Continuous: read honestly
- Segment before shipping: device, source, new/returning minimum.
- Document winners and losers. ~40% of teams never ship winning variants—check that too.
- Reconcile quarterly: does the “win” show up in revenue and retention?
Low traffic (<10k sessions/month, <200 conversions/month)? Skip frequent small tests. Fix defects directly, run fewer bigger changes, lean on interviews and Baymard-style heuristics. Five interviews beat 90 days of inconclusive A/B theatre.
Benchmarks (context, not targets)
- B2B SaaS landing: ~4.1% median
- DTC add-to-cart: ~2.3%
- Lead-gen quote: ~6.8%
- Ecommerce purchase: ~2–3.5%
Email traffic (~19.3%) converts far above cold organic (~2.7%)—audience fit matters more than layout. Desktop often converts ~1.25–1.4× mobile. Never benchmark a $2,000 product against a consumables store. See our 2026 conversion benchmarks by store type for segmented tables.
What the science and top blogs agree on
CXL, VWO, Optimizely, Invesp, Conversion Rate Experts, and Baymard converge on process over tactics: research before testing, revenue per visitor plus segments, document losers, fix checkout and trust before personalization. Wharton’s 2,732-test study found price and category-page changes often beat cosmetic design tests. Baymard’s 200,000+ hours of UX research tie average checkout fixes to ~+35% conversion potential.
Papers worth knowing: Zimmermann & Auinger (2023) on quantifying touchpoints with Bayes; Ziakis (2026, n=184) on trust ranking above personalization; Miikkulainen’s Ascend work on evolutionary testing for interaction effects human A/B misses.
30-day starter checklist
- ☐ Mobile LCP < 2.5s on top 3 money pages
- ☐ Five-second headline test passes (stranger knows what + who for)
- ☐ One named proof element next to primary CTA
- ☐ Form fields cut to essentials; guest checkout live
- ☐ Paid traffic → dedicated message-matched pages (not homepage)
- ☐ Sticky CTA shipped; redundant hero buttons removed
- ☐ Sample sizes pre-calculated; losers library started
- ☐ One low-confidence inversion test queued at 99% significance
CRO in 2026 is not magic buttons—it is a system that gets sharper every cycle. Specificity at every layer, subtraction over addition, fewer better-powered tests, every result feeding the next hypothesis. Run the checklist, then stress-test the upside in the Ecommerce Simulator before you scale spend.