Why do 7 out of 10 ecommerce carts get abandoned?
Cart abandonment — About 70% of carts never complete—often because of late shipping surprises, forced accounts, excess form fields, weak payment-step trust, and vague delivery dates. Baymard’s research across 11,777 participants ranks these friction points; most fixes are configuration or copy, not a dev sprint.
Benchmarks
Average ecommerce cart abandonment rate is 70.19%.
Source: Baymard Institute — Cart Abandonment Rate Statistics (2025)
Mobile cart abandonment is ~80.02% vs ~66.41% on desktop.
Source: Baymard Institute — Cart Abandonment Rate Statistics (2025)
Unexpected extra costs (shipping, taxes, fees) drive ~48% of preventable cart abandonments.
Source: Baymard Institute — Checkout Usability Research (2025)
Forced account creation drives ~26% of preventable checkout abandonments.
Source: Baymard Institute — Checkout Usability Research (2025)
Key takeaways
- Average cart abandonment in 2025 is ~70.19% (80% mobile vs. 66% desktop)—based on Baymard’s 49-study meta-analysis.
- Top preventable drivers: unexpected costs (48%), forced accounts (26%), too many fields (21%), security cues (25%), unclear delivery (23%).
- ~58% of abandonments are browse-and-save behavior; friction-driven loss is still ~30–35% of cart starts.
- Highest-leverage fixes: surface shipping earlier, enable guest checkout, audit fields, trust at payment, specific delivery dates.
- A three-touch abandonment email sequence can recover ~7–10% of recoverable carts without discounting on email one.
On this topic: Ecommerce Simulator · Online Business Lost Sales: The Complete 2026 Data Study — Why 70% of Carts Abandon, Conversion Rate Optimization in 2026: What Actually Works (With Receipts)
Cart abandonment isn't random. A decade of usability research across 11,777 participants and 49 independent studies identified the precise friction points that kill checkout. Most of them are fixable in under a day.
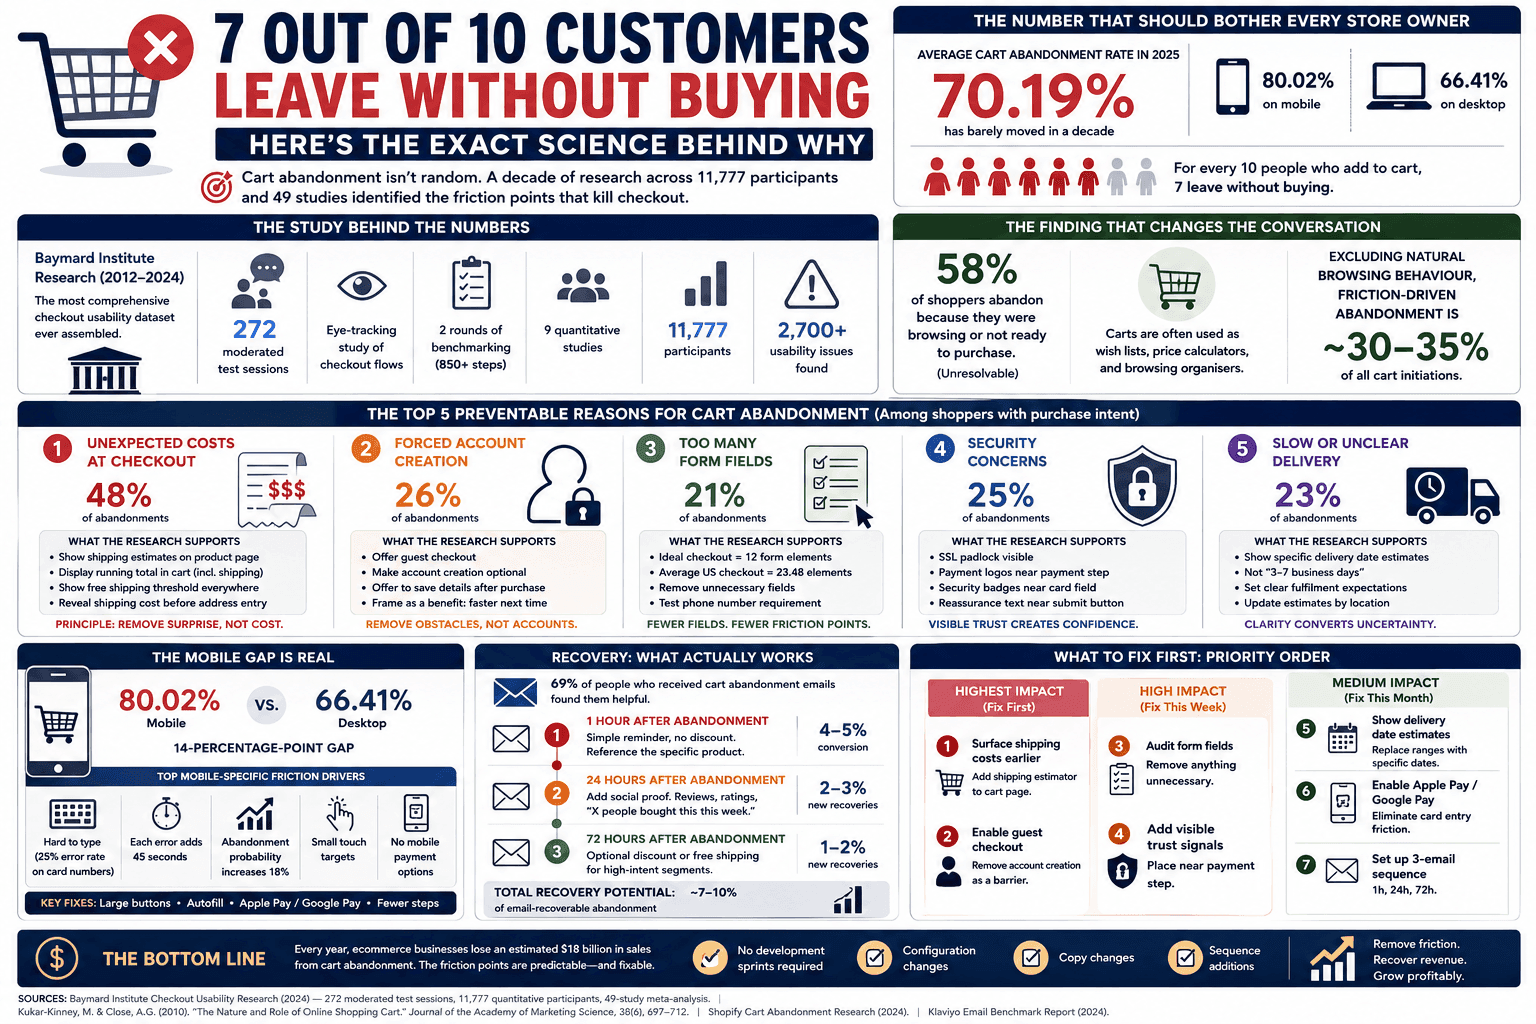
The number that should bother every store owner
The average cart abandonment rate across all online stores in 2025 is 70.19%, based on Baymard Institute's aggregation of 49 independent studies. That figure has barely moved in a decade.
In practical terms: for every 10 people who show enough intent to add something to their cart, 7 leave without buying. On mobile, that number climbs to 80.02%, compared to 66.41% on desktop.
The instinct is to treat this as a traffic problem—to spend more on ads, find better audiences, improve product pages. But the research says otherwise. A significant portion of those 7 people wanted to buy. They had your product in their cart. Something in your checkout stopped them.
This article is about exactly what that something is, based on the largest and most rigorous body of research ever conducted on checkout usability. For directional benchmarks and simulators, see ecommerce benchmarks (2026) and the Ecommerce Simulator.
Why do shoppers abandon carts? Baymard 2025 breakdown
Among shoppers with genuine purchase intent, Baymard's research ranks the preventable reasons they leave checkout. Use this list as a diagnostic checklist—not every store will hit every percentage, but the order of impact is remarkably consistent:
- Unexpected extra costs (shipping, taxes, fees revealed late) — ~48%
- Forced account creation before payment — ~26%
- Security / trust concerns at payment — ~25%
- Unclear or slow delivery estimates — ~23%
- Too many form fields / complicated checkout — ~21%
- Couldn't see / calculate total upfront — common friction in form-heavy flows
- Website errors / crashes / payment failures — technical reliability
- Returns policy unclear or too strict — trust at the decision point
- Preferred payment method missing (cards, wallets, BNPL)
- Card declined / payment friction without recovery UX
About 58% of overall abandonment is browse-and-save behavior Baymard treats as unresolvable. The friction list above is what you can still fix—roughly 30–35% of cart starts.
The study behind the numbers
Most cart abandonment statistics floating around the internet cite a single source: the Baymard Institute, an independent web usability research organisation that has been studying checkout flows since 2012.
Their methodology is unusually rigorous. The findings are based on:
- Qualitative usability testing with 272 test subjects following the “Think Aloud” protocol
- A large-scale eye-tracking study of checkout flows
- Two rounds of checkout benchmarking covering more than 850 checkout steps
- Nine quantitative studies with a total of 11,777 participants
The scale of what they found is striking. Despite testing leading ecommerce sites, participants encountered over 2,700 instances of checkout usability issues across the sessions.
These weren't obscure edge cases. They were the same friction points, appearing again and again, on the checkout flows of the biggest and most well-resourced stores in the world. For a Shopify or WooCommerce store without a dedicated UX team, the gap is almost certainly larger.
Reason #1: Unexpected costs at checkout (48% of abandonments)
The single biggest cause of cart abandonment is unexpected additional costs—shipping fees, taxes, and other charges that only appear at checkout—accounting for nearly half of all abandonments among shoppers who were genuinely considering purchasing.
This is not a pricing problem. It is a transparency problem.
The customer who abandons at the shipping fee reveal wasn't unwilling to pay for shipping. They were unwilling to be surprised by it at the last step of a process they had invested time in. The surprise itself—the mismatch between the expected total and the real one—triggers a loss aversion response. The purchase no longer feels like a good deal, even if the total price is objectively reasonable.
The fix is not always to offer free shipping. The fix is to surface the full cost earlier.
What the research supports:
- Display shipping estimates on the product page, not just at checkout
- Show a running total including estimated shipping in the cart—before the customer initiates checkout
- If you offer a free shipping threshold, make it visible on every product page and in the cart: “Add $12 more for free shipping”
- If you can't offer free shipping, show the shipping cost clearly in the cart step before the customer has entered their address
The principle is removing surprise, not removing cost.
Reason #2: Forced account creation (26% of abandonments)
Over a quarter of shoppers abandon when forced to create an account before completing their purchase. This is the second most preventable cause of checkout abandonment, and also one of the simplest to fix.
A customer who has just decided to buy something is in a completion mindset. Inserting an account creation flow—password, email confirmation, profile setup—introduces a completely different task. It doesn't feel like part of buying. It feels like work in exchange for the privilege of giving you money.
The research-backed solution is guest checkout—allowing purchase completion without account creation, then offering the option to save details afterward: “Save your details for faster checkout next time.” At that point, the customer has already completed the purchase and is in a satisfied state. Account creation framed as a post-purchase convenience converts at far higher rates than account creation as a checkout gate.
Reason #3: Too many form fields (21% of abandonments)
The ideal checkout flow can be reduced to as little as 12 form elements: 7 form fields, 2 checkboxes, 2 drop-downs, and 1 radio button interface. Yet the average US checkout flow contains 23.48 form elements displayed to users by default—14.88 if counting only form fields.
That means the average checkout asks customers to fill out almost twice the number of fields actually needed to complete a purchase. For most checkouts, it is possible to make a 20–60% reduction in the default number of form elements shown to users.
Fields that typically disappear under optimisation:
- Separate title/salutation field
- Middle name
- Company name (shown to everyone when only relevant to B2B buyers)
- Second address line as a mandatory field
- Phone number when it serves no operational purpose for the order
Users become overwhelmed and intimidated by excessive form requirements—the complication of the checkout process accounts for 21% of abandonment among shoppers who had genuine intent to purchase. Every additional form field is a micro-decision. The cumulative effect is a checkout that feels like an obstacle course rather than a completion step. Pair field audits with checkout flow optimization beyond abandonment metrics.
Reason #4: Security concerns (25% of abandonments)
A quarter of shoppers leave due to concerns about the security of sharing their payment information. This is a trust signal problem, not a security infrastructure problem. Stripe, PayPal, and Shopify Payments already meet high PCI-DSS standards—the issue is that the customer can't see this.
Research-backed cues that move this needle:
- SSL padlock visibility in the browser bar
- Payment provider logos (Visa, Mastercard, PayPal, Apple Pay) prominently near the payment step
- Security badge placement close to the card entry field rather than in the footer
- Explicit reassurance line near the submit button
For a complementary trust lens, see why shoppers don't buy: trust science.
Reason #5: Slow or unclear delivery (23% of abandonments)
Delivery speed is the single most important logistics factor for many customers, with 23% citing slow or unclear delivery timelines as a reason for abandonment.
Two related problems collapse into this category: delivery speed (Amazon has trained a two-day benchmark) and delivery clarity—customers abandoning not because delivery is slow, but because they don't know when it will arrive.
Displaying a specific, credible delivery date estimate—not “3–7 business days” but “Estimated delivery: Wednesday, June 4”—has been shown in usability testing to resolve a significant proportion of delivery-related abandonment. The customer isn't necessarily unwilling to wait a week. They're unwilling to commit to an unknown.
The finding that changes how you think about abandonment
Academic research by Kukar-Kinney and Close (2010), published in the Journal of the Academy of Marketing Science, identified that the shopping cart serves a fundamentally different function for many shoppers than the checkout model assumes. Customers frequently use online carts as wish lists, price calculators, and browsing organisers—with no immediate intention to purchase.
Baymard confirmed this: the top reason for cart abandonment—cited by 58% of respondents—was that they were simply browsing or not ready to purchase. Baymard explicitly excluded this category from their optimisation recommendations, classifying it as unresolvable.
This reframes the 70% figure meaningfully. If you exclude natural browse-and-save behaviour, the proportion of abandonment caused by actual checkout friction drops to roughly 30–35% of all cart initiations—which is still a massive number, but it means your optimisation efforts are targeting a smaller, higher-intent pool where changes have a proportionally larger impact.
Researchers broadly agree that the biggest friction-driven abandonment causes are: lack of pricing transparency, unclear delivery and transaction costs, lack of trust in the seller, and poor website functioning or complicated processes. These are the levers worth pulling.
The mobile gap is its own problem
Mobile abandonment sits at 80.02% compared to 66.41% on desktop—a 14-percentage-point gap that represents a structural problem, not just a scaling issue.
Baymard usability testing highlights form entry friction: typing a 16-digit card number on a touchscreen has a 25% error rate, and each error adds 45 seconds while increasing abandonment probability by 18%.
Key mobile interventions:
- Large touch targets on all form fields and buttons
- Autofill support for address and payment fields
- Apple Pay and Google Pay that bypass manual card entry
- A checkout flow that minimises scrolling between steps
Enabling a single-tap payment option on mobile can eliminate card entry friction for a significant proportion of mobile buyers. Context on device splits: ecommerce conversion benchmarks by store type (2026).
Recovery: what actually works after abandonment
Research shows that 69% of people who received cart abandonment reminder emails found them helpful in some way—these emails are not cold outreach. The recipient chose the product. The email is a reminder of a decision they were close to making.
The effective sequence based on industry research:
- Email 1 (1 hour after abandonment): Simple reminder, no discount. Subject line referencing the specific product. Conversion rate approximately 4–5% of recipients.
- Email 2 (24 hours after abandonment):Social proof—reviews, ratings, or “X people bought this this week.” Conversion rate approximately 2–3% of new recoveries.
- Email 3 (72 hours after abandonment): Optional discount or free shipping for high-intent segments. Conversion rate approximately 1–2% of new recoveries.
The sequence captures roughly 7–10% of email-recoverable abandonment across three touches—without competing on discount depth from the first message.
What to fix first: a priority order based on impact
Not all friction points have equal leverage. Based on the abandonment percentages from the Baymard research, the priority order for most Shopify and WooCommerce stores is:
Highest impact (fix first):
- Surface shipping costs earlier. Add a shipping estimator to the cart page—before checkout initiation. This single change addresses the most common abandonment cause at the moment it matters most.
- Enable guest checkout.If you're still requiring account creation as a checkout gate, this is your biggest single conversion lever. The fix is a settings change on most platforms.
High impact (fix this week):
- Audit your form fields. Count every field in your checkout. Remove or make optional anything beyond: name, email, shipping address, payment details. Test whether phone number is operationally required.
- Add visible trust signals at the payment step. Payment provider logos and an SSL reference directly adjacent to the card field, not in the page footer.
Medium impact (fix this month):
- Replace vague delivery windows with specific date estimates.Generate an actual arrival date based on fulfilment time and the customer's location.
- Enable Apple Pay / Google Pay on mobile. Eliminates card entry friction for the segment most likely to abandon.
- Set up a three-email abandonment sequence. Email 1 at one hour, reminder only. Email 2 at 24 hours with social proof. Email 3 at 72 hours, optional offer.
Stress-test margin and completion assumptions with the Ecommerce Simulator and customer metrics hub after you ship changes.
The bottom line
Every year, ecommerce businesses lose an estimated $18 billion in sales revenue from shopping cart abandonment. Approximately 70% of online shopping carts are abandoned before checkout—but many of these abandonments are preventable.
The Baymard research, the most comprehensive checkout usability dataset ever assembled, consistently finds the same pattern: the friction points killing conversion are not exotic or technical. They are unexpected costs, unnecessary account creation requirements, too many form fields, invisible trust signals, and unclear delivery information.
None of these require a development sprint. Most are configuration changes, copy changes, or sequence additions your current platform already supports.
The stores that have closed this gap did not do it with better products or bigger ad budgets. They did it by removing the friction that was standing between a customer who had already decided to buy and a completed order.
Sources: Baymard Institute Checkout Usability Research (2024)—272 moderated test sessions, 11,777 quantitative participants, 49-study meta-analysis. | Kukar-Kinney, M. & Close, A.G. (2010). “The Nature and Role of Online Shopping Cart.” Journal of the Academy of Marketing Science, 38(6), 697–712. | Shopify Cart Abandonment Research (2024). | Klaviyo Email Benchmark Report (2024).