Ecommerce Conversion Rate Optimization: What Research Says About Testing, Traffic and…
Ecommerce conversion rate optimization backed by research: how often tests win, why peeking creates false winners, how much traffic a store needs, and what studies of reviews, choice, retargeting and dark patterns found.
Key takeaways
- Only about one third of tested ideas improved their target metric at Microsoft, so expect most tests to be flat or lose.
- Stopping a test the moment it looks significant makes standard p-values unreliable, so set the sample size and end date first.
- By our calculation, detecting a 10% lift on a 2% baseline needs about 80,600 visitors per version.
- Dynamic retargeting ads were less effective than generic ones on average in one field experiment.
- About 73% of experimenters in 2,101 A/B tests stopped just when a positive result hit 90% confidence, inflating false discoveries.
- A short test win may not last: Google found short-term effects are not always predictive of long-term ones.
- Mild dark patterns more than doubled acceptance in one experiment, but refunds, backlash and legal risk can cancel the lift.
- Judge every test on profit per visitor after returns and fees, not on conversion alone.
On this topic: Ecommerce Simulator · How to Start an Online Business With AI: What Studies and Five Startups Show, Ecommerce Monetization: What Field Evidence Says About Pricing, Shipping and Returns
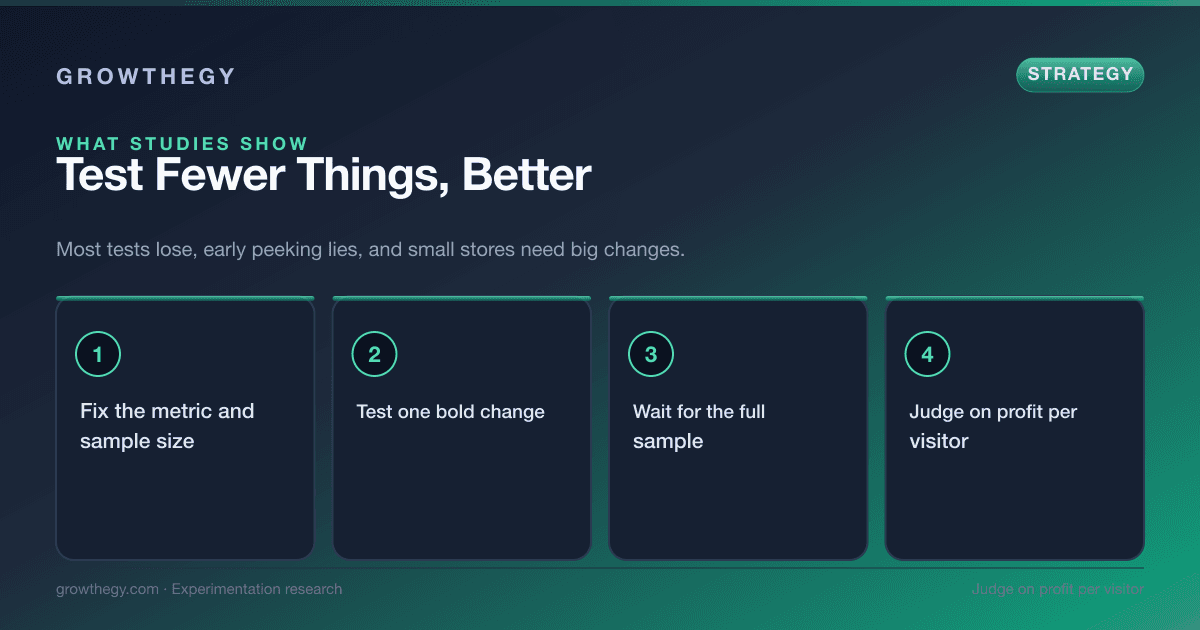
Ecommerce conversion rate optimization (CRO)is the practice of raising the share of visitors who buy, by testing changes to pages, offers and traffic. The research says three things: most tests don't win, tests stopped early give false winners, and a store needs far more traffic to detect a small lift than most owners expect. Run fewer, better-planned tests and judge them on profit, not on conversion alone.
We started with a Google Scholar search for "ecommerce conversion rate optimization". The first page returned ten items: two papers from one vendor on automated page testing, a handful of practitioner books, case studies and a 2026 survey. Almost none of them measures the effect of a page change on real orders. So this guide uses that survey, the vendor paper with its caveats, and eleven further studies, a book chapter and two company blog posts from the experimentation, advertising, consumer psychology and consumer-protection literature that answer questions a store owner has. For each, we say what was measured and how far to trust it.
What do e-commerce marketers say works for CRO?
Makridakis, Spiliotopoulos and Lymperi surveyed 302 digital marketing professionals (421 were invited, a 71.7% response rate), mostly in Europe, and asked them to rate 11 tactics on effectiveness and 7 on efficiency from 1 to 5. Email marketing scored highest on both (effectiveness 4.41, efficiency 4.49). Search ads scored second on effectiveness (4.31) but showed the biggest gap between effectiveness and efficiency. A/B testing (4.10) and on-site personalization (4.01) sat in a middle group, and influencer marketing scored lowest (3.31). The respondents rated attribution difficulty as the top barrier to CRO (mean 4.09, 73.8% agreement). Administrative Sciences, 2026.
Treat this as opinion, not outcome data. The authors say it themselves: the ratings are perceptions, not analytics, the design is cross-sectional so it can't show cause, and the sample is concentrated in Europe. It does tell you what experienced marketers believe and where they struggle: knowing which channel deserves credit for a sale.
How often does a tested idea actually win?
Rarely. Microsoft's experimentation team reported that only about one third of tested ideas improved the metric they were designed to improve, and a Bing post on large-scale experimentation says that in an already optimized product, fewer than a third move their target metrics. Bing Search Quality Insights, 2013. The one-third figure appears to trace back to earlier Microsoft papers that we could not open, so the Bing post is our only source for it.
These are large-company numbers on mature products, and a new store has more obvious fixes to make. The useful lesson is not the exact share. It is that a well-run test program expects to discard many ideas, and that a team measuring "tests launched" instead of "tests that held up" will fool itself.
Why does checking a test early produce false winners?
Johari, Pekelis and Walsh show that standard A/B test p-values and confidence intervals become "wholly unreliable" when people choose their sample size by continuously monitoring a running test and stopping when it looks significant. They propose "always valid" p-values that stay correct however often you look, and say the method has been used to analyze hundreds of thousands of experiments on a commercial platform. arXiv 1512.04922. Their fix costs some statistical power, so it isn't free.
The behavior is common. Berman, Pekelis, Scott and Van den Bulte analyzed 2,101 commercial experiments on the Optimizely platform, where experimenters could see the effect and its significance every day. About 73% of experimenters stopped a test just when a positive effect reached 90% confidence, and the authors estimate that about 75% of the effects tested were truly null. Stopping this way raised the false discovery rate from 33% to 40% among the tests that were stopped at 90% confidence. Working paper, December 2018. We read the working-paper abstract, so figures in the final published version may differ.
What to do: set the sample size and end date before you start, and don't call a winner on day three because the dashboard turned green. If your tool offers sequential testing built for continuous monitoring, use it. If it uses fixed-horizon statistics, wait for the full sample. The Kohavi, Tang and Xu book on trustworthy experiments also devotes a chapter to sample ratio mismatch, which means checking that the traffic split you asked for is the split you got before reading any result. Cambridge University Press.
How much traffic does a small store need?
More than most expect. This is our own calculation, using the standard two-sided test at 5% significance and 80% power, and it assumes a plain split test with one conversion goal.
| Baseline conversion | Lift you want to detect | Visitors needed per version |
|---|---|---|
| 2.0% | 10% relative (2.0% to 2.2%) | about 80,600 |
| 2.0% | 20% relative (2.0% to 2.4%) | about 21,100 |
| 3.0% | 10% relative (3.0% to 3.3%) | about 53,200 |
A store with 20,000 visitors a month can reliably test only big changes. Small tweaks such as a button color will take months to read, which is part of why they so rarely show a clear result.
Azevedo, Deng, Montiel Olea, Rao and Weyl studied how to split a fixed experimentation budget. Using experiments from Microsoft Bing's platform, they argue that when the payoff from ideas has very fat tails, meaning a few rare ideas deliver most of the gain, it is better to test more ideas with smaller samples than a few ideas with large ones. When the tails are thinner, a few high-powered tests are best. Journal of Political Economy, 2020. Our reading for a small store: with limited traffic, put it behind big, bold changes (a new offer, a different page structure, a pricing or shipping change) rather than many small ones, and don't expect Bing's numbers to match yours.
Can you reach a result with less traffic?
Sometimes. Deng, Xu, Kohavi and Walker describe CUPED, a method that uses each user's behavior before the test to remove predictable noise from the result. On Bing's experimentation system it reduced variance by about 50%, which they say gives the same statistical power with half the users or half the duration. WSDM 2013. It needs a history for each visitor, so it suits stores with many returning customers more than stores whose traffic is mostly first-time visitors. Several testing tools offer it, so check whether yours does before you plan a long test.
Do customer reviews change what people buy?
Chevalier and Mayzlin compared books on Amazon.com and BarnesandNoble.com. They found that an improvement in a book's reviews led to higher relative sales at that site, and that one-star reviews had a larger effect than five-star reviews. NBER working paper 10148, 2003; published in the Journal of Marketing Research, 2006. The data are observational and from books, and the effect is on relative sales between two sites, so it doesn't show that adding reviews raises a store's total sales. It does suggest that hiding bad reviews may matter less than having a steady stream of honest ones, since the bad ones moved sales more.
Does showing fewer products raise conversion?
The "too many options" idea is popular, but the evidence is mixed. A meta-analysis of 63 conditions from 50 experiments (5,036 participants) found a mean effect of virtually zero, with large differences between studies and no condition that reliably produced choice overload. Scheibehenne, Greifeneder & Todd, Journal of Consumer Research, 2010. Don't assume that cutting your catalog will lift sales. If you want to try it, test it on one category and watch revenue per visitor, not only conversion.
Do manipulative design tricks raise conversion, and what do they cost?
They do raise it, which is the problem. Luguri and Strahilevitz randomly assigned a representative sample of American consumers to a control, mild dark patterns or aggressive dark patterns while they decided whether to decline an identity-theft protection plan. In the August 2019 draft, 11.3% accepted in the control group (73 of 644), 25.8% with mild patterns (155 of 600) and 41.9% with aggressive patterns (217 of 518). Aggressive patterns produced a strong backlash. Mild ones did not, and less educated participants were more susceptible to them. Journal of Legal Analysis, 2021; SSRN draft. The study used a fictional service and a survey sample, and the published version may report slightly different numbers.
Mathur and colleagues looked at about 53,000 product pages from about 11,000 shopping sites and found 1,818 dark pattern instances in 15 types, with 183 sites using practices they classed as deceptive. CSCW 2019, "Dark Patterns at Scale". A test can show a lift from a countdown timer that resets or a pre-ticked add-on and still lose money later through refunds, chargebacks, complaints and legal risk. Count refunds and repeat purchases in the result, and skip tricks you wouldn't want a customer to see explained.
Does revealing the full price early cost you sales?
Yes, in the one large field experiment we found, and that is the point. Blake, Moshary, Sweeney and Tadelis ran an experiment on the ticket marketplace StubHub in which users were randomly assigned to see the full price, fees included, or to see fees only at checkout. Making the full price salient reduced both the quantity and the quality of what people bought, and the quality effect accounted for at least 28% of the revenue decline. The effects persisted beyond the first purchase and also affected experienced users. Click data showed that hiding fees made price comparison harder, so people spent more than they otherwise would. Marketing Science, 2021 (NBER working paper 25186). We read the working-paper abstract.
This is a good example of a test that "wins" for the seller by making comparison harder. It is a ticket marketplace, so the result may differ in your category, and it connects to the dark pattern results above and to the shrouded-price experiment in our monetization evidence guide. Before you hide a fee, ask what happens to refunds, complaints and repeat orders, which a two-week test won't show.
Will a test win last after launch?
Not always. Hohnhold, O'Brien and Tang at Google point out that the short-term effect seen during an experiment is not always predictive of the long-term effect, once users have changed their behavior in response. They developed methods to measure long-term user learning and applied them to ads on Google search. They found that how often people click ads changes with the quality of the ads they saw before, and used the results to cut the ad load on mobile search by 50%. KDD 2015. This is a search engine, not a store, but the lesson carries: a tactic that squeezes more out of each visit can teach customers to ignore or distrust you. Keep a small holdout group after launch and recheck the result after a few months.
Can automated testing find much better pages?
Miikkulainen and colleagues, at the company Sentient Technologies, describe Ascend, a system that evolves page designs by showing many combinations of elements to live visitors in parallel and keeping the winners. In a case study on an existing media site, they report improvements of over 43% beyond the human-designed page. arXiv 1703.00556. The authors sell the product, the evidence is one site, and it is a media site where the goal was sign-ups, not a store selling physical goods. Read it as a sign that combinations of page elements can interact in ways a one-change-at-a-time test misses, not as a promise of a 43% lift.
Does retargeting with the exact product you viewed work better?
Lambrecht and Tucker ran a field experiment with an online travel company and found the opposite of the common assumption. On average, dynamic retargeted ads that showed the specific hotel a visitor had viewed were less effective than generic brand ads. Dynamic ads did better only after the visitor had visited a review site, which the authors link to how people move from broad to specific preferences during a search. Journal of Marketing Research, 2013. This is one company and one category, so test it in yours, but it is a good example of an intuitive tactic that failed in a controlled test.
Does a faster page raise conversion?
Mozilla randomly showed visitors faster or slower versions of its download page and estimated that each extra second of load time reduced conversions by about 2.7%. It was a blog post by Mozilla's analytics team, not a peer-reviewed paper, and for a free software download, not a purchase, so the effect on a store may differ. Mozilla Metrics blog, 2010. We found no peer-reviewed randomized test of load time on an online store, so we treat speed as a likely benefit worth checking in your own analytics, not a measured rate.
How should a store run CRO in practice?
- Weeks 1 to 2: fix the metric. Use profit per visitor after returns, fees and discounts. Our monetization evidence guide explains why conversion alone can mislead.
- Weeks 3 to 4: find the biggest drop-off. Look at where visitors leave: product page, cart, shipping step or payment. Fix measurement first. Attribution was the top barrier in the practitioner survey, so check your analytics before you test.
- Weeks 5 to 10: test one bold change.Calculate the sample size first (table above), write down the end date, check the traffic split, and leave the test alone until it ends. Count refunds and returns in the result, so a trick that lifts orders but raises refunds doesn't look like a win.
- Weeks 11 to 12: read, then decide. Judge on profit per visitor. If the result is flat, keep the simpler version and move to the next idea, since a flat result is the most common outcome.
- Then repeat. Keep a small holdout after launch and recheck winners after a few months. Keep a log of ideas, results and sample sizes. Add retention work on top: our retention evidence guide covers it.
Before you spend traffic on a test, try the idea in the Ecommerce Simulator, which models conversion, margin, fees and shipping, so you can see which change moves profit most.
What this evidence cannot tell you
Few of these sources test a page change on an online store. The practitioner survey measures opinions. The one-third win rate comes from Microsoft products. The 43% result is a vendor's single case study. The retargeting test used a travel company, and the speed test used a software download page. We could not read the AAAI version of the Ascend paper, and we use the arXiv version. We found no peer-reviewed randomized test of common store changes such as button color, trust badges or checkout layout, so we make no claims about them. The review study is observational and uses books, the dark pattern experiment used a fictional service, and the price salience test used a ticket marketplace. We read the Berman and Luguri papers as working-paper or draft versions. The sample-size table is our own arithmetic, not a result from a paper.
Selected studies and sources
- Makridakis, Spiliotopoulos & Lymperi (2026), effectiveness and efficiency of digital marketing tactics in e-commerce CRO, survey of 302 professionals, Administrative Sciences. DOI: 10.3390/admsci16070345
- Miikkulainen et al. (2017), conversion rate optimization through evolutionary computation, Sentient Ascend. arXiv 1703.00556
- Johari, Pekelis & Walsh, always valid inference for A/B testing. arXiv 1512.04922
- Azevedo, Deng, Montiel Olea, Rao & Weyl (2020), A/B testing with fat tails, Journal of Political Economy. DOI: 10.1086/710607
- Berman, Pekelis, Scott & Van den Bulte (2018), p-hacking and false discovery in A/B testing, 2,101 experiments, working paper. SSRN 3204791
- Deng, Xu, Kohavi & Walker (2013), improving the sensitivity of online controlled experiments with pre-experiment data (CUPED), WSDM. ExP Platform
- Chevalier & Mayzlin (2006), the effect of word of mouth on sales: online book reviews, Journal of Marketing Research. NBER 10148
- Scheibehenne, Greifeneder & Todd (2010), choice overload meta-analysis, 63 conditions, Journal of Consumer Research. DOI: 10.1086/651235
- Luguri & Strahilevitz (2021), dark patterns experiment, Journal of Legal Analysis. SSRN 3431205
- Mathur et al. (2019), dark patterns at scale, ~11K shopping sites, Proceedings of the ACM on Human-Computer Interaction (CSCW). DOI: 10.1145/3359183
- Blake, Moshary, Sweeney & Tadelis (2021), price salience and product choice, StubHub field experiment, Marketing Science. NBER 25186
- Hohnhold, O'Brien & Tang (2015), focus on the long-term, KDD. Google Research
- Lambrecht & Tucker (2013), when does retargeting work, Journal of Marketing Research. DOI: 10.1509/jmr.11.0503
- Mozilla Metrics (2010), page load time and conversion, randomized test (blog post). Mozilla blog
- Bing Search Quality Insights (2013), large scale experimentation at Bing. Bing blog
- Kohavi, Tang & Xu, Trustworthy Online Controlled Experiments, chapter on sample ratio mismatch. Cambridge University Press
Research synthesis by Moheb. Published 7 November 2026.
Practice a decision in the Ecommerce Simulator | Read the monetization evidence guide